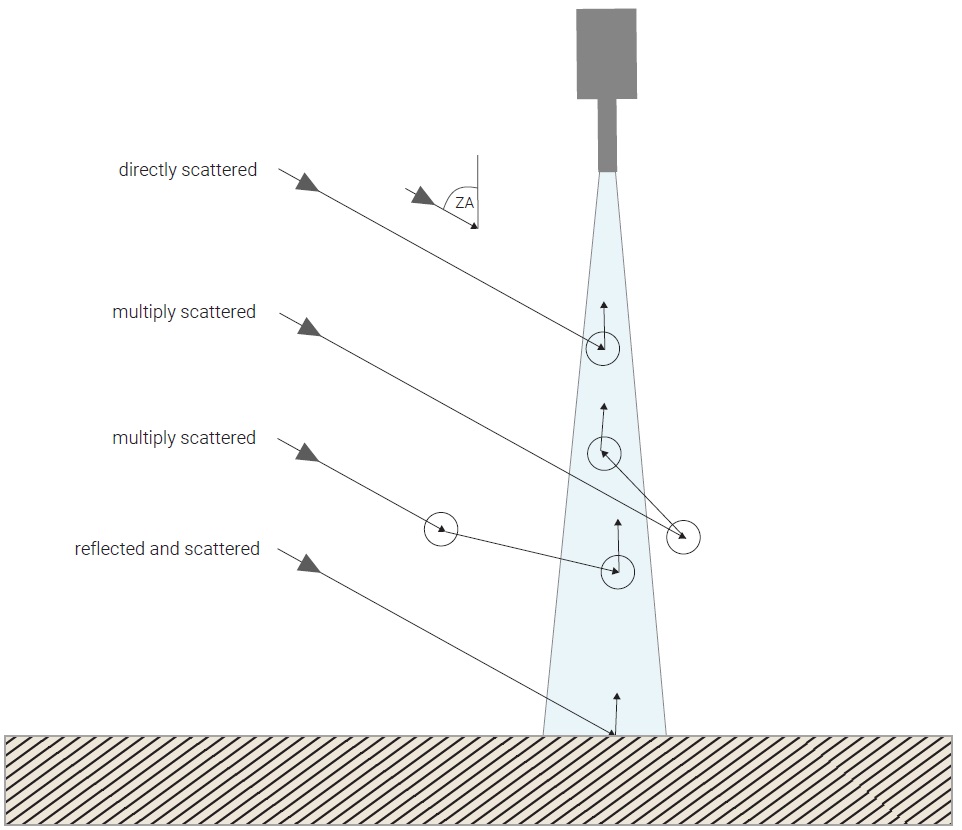
4 Viewing geometries
4.1 Overview
This section gives a short explanation of the air mass sampled in the different observation modes. It uses the “effective height” () of a trace gas, which is given by:
\[\text{h}_{\text{EFFj}} = \frac {\int\limits_{\text{SURF}}^{\text{ToA}} \text{n}_{\text{j}}(\text{h}) \cdot \text{h} \cdot \text{dh}} {\int\limits_{\text{SURF}}^{\text{ToA}} \text{n}_{\text{j}}(\text{h}) \cdot \text{dh}} \tag{4.1}\]
The integral runs from the surface SURF to the top of the atmosphere ToA along the vertical path h. n\(_\text{j}\)(h) is the particle density of the trace gas at height h.
Another expression introduced is the “Effective Ground Location” (EGL). The EGL is defined as that location on the ground, for which the measurements are “most representative”, which is in general NOT the location of the ground-based instrument or the center of the satellite’s footprint projected to the ground.
4.2 Direct sun or moon
The viewing geometry of the direct sun or moon observation mode is outlined in Figure 4.1. The sampled air mass is a circular cone with its apex at the entrance of the instrument and extending into the direction of the sun or moon. This means that for direct sun observations, the measurements sample air towards East in the morning, South around noon, and West in the afternoon (for Northern Hemispheric locations).
For PGN direct sun observations, the opening angle of the cone is about \(\alpha\) = 2.6° = 0.045 rad, which is the FWHM angle of the Pandora FOV in direct sun mode. For direct moon observations, the FWHM of the FOV is \(\alpha\) = 1.5° = 0.026 rad. However the vast majority of the light sampled in direct observation mode comes from an angle of 0.5° = 0.009 rad, since this is the angular size of both the sun and the moon. The direct light comes from inside these 0.5°, the forward scattered diffuse light is distributed over the entire FOV of the instrument. Only at large ZA and high aerosol content is the diffuse fraction significant (a few percent of the total signal) and can possibly introduce systematic errors in the retrieval. Each trace gas molecule inside the cone is equally “counted”, i.e. there is no dependence of the vertical profile in the data.
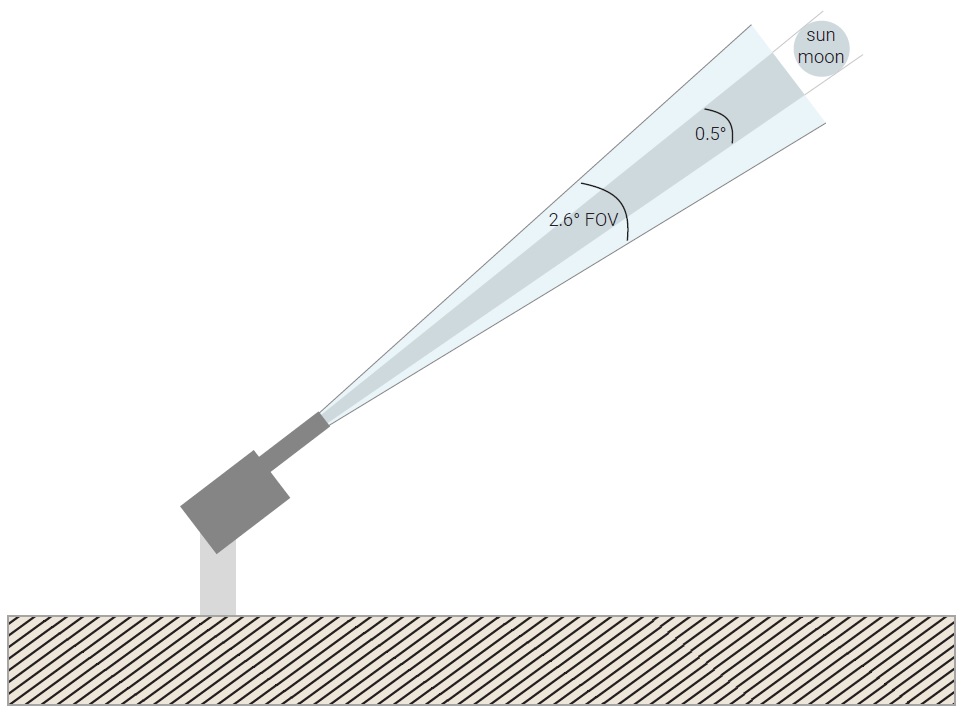
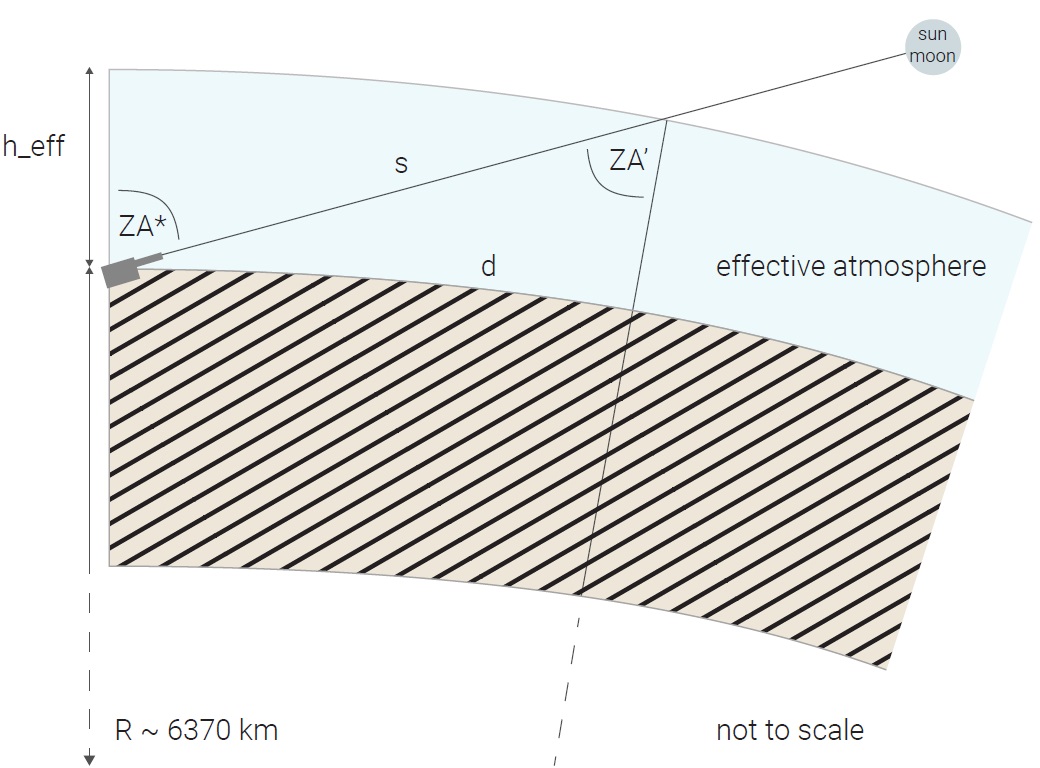
Figure 4.2 shows a simplification for the situation for direct sun observations. R is the distance from the center of the Earth to the measurement location (about 6370 km, refined based on the location’s latitude), ZA* is the apparent solar (or lunar) zenith angle (i.e. the geometrical ZA corrected for refraction) and h\(_\text{EFF}\) is the effective height for the trace gas (from Equation 4.1). Note that if h\(_\text{EFFj}\) is smaller than 10 km (“tropospheric effective height”), the effective height is added to the station height. Otherwise (“stratospheric effective height”), the station height is ignored and the effective height is added to the Earth’s surface. s is the slant distance between the instrument and the point where the direct beam is at height h\(_\text{EFF}\) in the atmosphere. d is the ground distance between the location of the instrument and location underneath the point where the direct beam is at height h\(_\text{EFF}\) in the atmosphere. ZA’ is the “reduced” zenith angle, which can be calculated by Equation 4.2.
\[\text{ZA'} = \arcsin\left[\left( \frac{\text{R}}{\text{R}+\text{h}_\text{EFF}} \right) \cdot \sin(\text{ZA*})\right] \tag{4.2}\]
s and d can be calculated with Equation 4.3 and Equation 4.4 respectively.
\[\text{s} = \text{R} \cdot \frac{\sin(\text{ZA*}-\text{ZA'})}{\sin(\text{ZA'})} \tag{4.3}\]
\[\text{d} = \text{R} \cdot (\text{ZA*}-\text{ZA'}) \tag{4.4}\]
In combination with the solar or lunar azimuth, d can be used to estimate the EGL for direct observations. The estimation of the direct AMF in the PGN retrievals, used to convert the measured slant columns into vertical columns, is based on some assumptions, e.g. that the vertical distribution of the trace gas is a delta function at h\(_\text{EFF}\). It is given by Equation 4.5. For details on this equation see e.g. Bernhard et al. (2005).
\[\text{AMF}_{\text{DIR}}(\text{ZA*}) = \sec(\text{ZA'}) \tag{4.5}\]
The accuracy of AMF\(_\text{DIR}\) depends mostly on how well h\(_\text{EFF}\) represents the “truth”, but is in general better than 2% for ZA<80°.
4.3 Profile
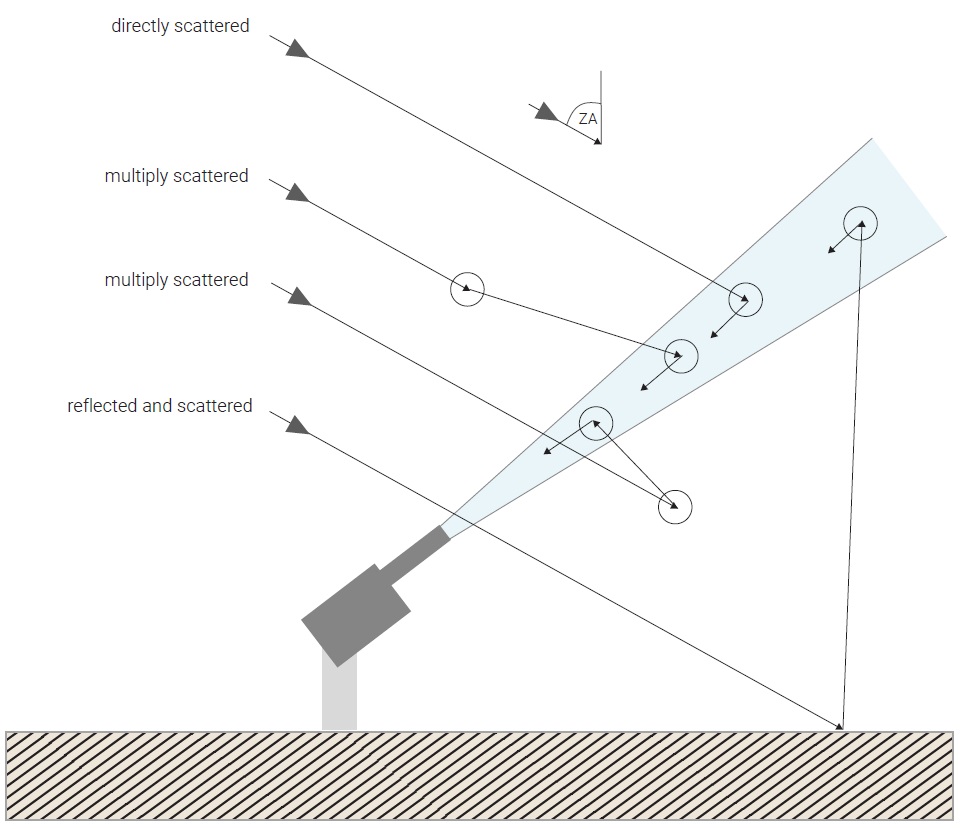
The viewing geometry of profile measurements (“MAXDOAS”) is outlined in Figure 4.3. The Pandora FOV for sky observations is circular with FHWM of \(\alpha\) = 1.5° = 0.026 rad. The photons captured by the instrument originate from the sun, enter the atmosphere in the direction of the solar ZA, and then make one or more interactions to be directed into the instrument. Some of them are reflected by the surface, others are scattered in the atmosphere to end up in the instrument’s entrance optics. A smaller fraction does even multiple interactions, e.g. reflection plus scattering, or two scatter processes, etc. Therefore the sampled air mass is a rather large “region” above the instrument. The EGL depends on where the instrument is exactly pointing and therefore changes for each of the elevation angles sampled by the instrument. Hence for profile observations, the EGL of the measurement is usually shifted relative to the instrument’s location, namely into the direction of the pointing azimuth.
4.4 Satellite nadir view
The viewing geometry of near nadir observations from satellite (or aircraft) is outlined in Figure 4.4. The FOV of the instrument projected to the ground gives the so-called footprint of the satellite instrument. In current satellites, the diameters of the footprint vary from about 5 km to more than 100 km. As for profile measurements, the photons captured by the satellite instrument originate from the sun, enter the atmosphere in the direction of the solar ZA, and then make one or more interactions to be directed into the satellite instrument. The sampled air mass is a rather large “region” underneath the satellite and in the direction of the Sun. Hence for nadir observations, the EGL is also shifted relative to the center of the footprint, namely towards East in the morning, South around noon, and West in the afternoon (for Northern Hemispheric locations). However the “displacement” into the direction of the sun is not as large as for direct observations.