2 L2 data retrieval setups
2.1 Overview
Each of the following subsections presents the readme page for all retrieval setups (“r-codes”) producing the L2 data products. It starts with an description of the related data product and is followed by a table with the major retrieval settings such as the cross sections used, the wavelength range for the spectral fitting etc. Note that partially we skip the leading “r” in the explanations (e.g. rout2 -> out2). The meaning of the entries in the tables is explained here:
Code creator(s)
The name of the person having created the r-code plus the creation date. If different persons have created the respective f-codes (see ATBD, table “f-codes”) used by the r-code, then their names are added as well.
QC limits creator(s)
The name of the person having created the qr-code (see ATBD, table “qr-codes”) plus the creation date. The qr-code sets the limits to determine the data quality (DQ). If different persons have created the respective qf-codes (see ATBD table, “qf-codes”) used by the f-code, then their names are added as well.
Data product(s)
A comma-separated string for each data product. Each substring gives the acronym of the species followed by the product type and the unit in square brackets. The product type can be:
TotCol: total vertical column amount of the trace gas between the surface and the top of the atmosphere. Starting with ProcVers 1.8, for most products the quantity is given in the SI-unit for column density, which is mole per square meter [mol/m\(^2\)] and each of the uncertainty types listed in Section 5.2 is given.
TropCol: tropospheric vertical column amount of the trace gas between the surface and approximately 4 km above the surface in the same unit as TotCol. For TropCols only the independent uncertainty is given at present (see Section 5.2).
SurfDens: the average number density of the trace gas in approximately the first 50 m above the surface. Starting with ProcVers 1.8, this quantity is given in the SI-unit for concentration, which is mole per cubic meter [mol/m\(^3\)]. For SurfDens only the independent uncertainty is given at present (see Section 5.2).
TropProf: partial column amounts of the trace gas for several layers between the surface and approximately 4 km above the surface in the same unit as TotCol. For TropProfs no output uncertainty is given at present. This output does not exist before ProcVers 1.8.
EffTemp: Effective temperature of the trace gas column in Kelvin [K]. This is the average of the trace gas temperature along its slant path weighted with its concentration along the slant path (more info in the ATDB, section “Table ‘Trace gases’”). Starting with ProcVers 1.8, each of the uncertainty types listed in Section 5.2 is given for EffTemp.
E.g. Data products “O3 TotCol [mol/m\(^2\)], O3 EffTemp [K]” means that this r-code has outputs 2 data products, the total ozone column and the effective ozone temperature.
Processor requirement
This gives the ProcVers needed to calculate the respective r-code. When such r-code is run on a ProcVers not listed, then BlickP typically does not produce any data. Note that when an r-code is run on an older previous ProcVers, it is possible that not all output products as listed in entry “Output product(s)” might be given. E.g., r-codes run with ProcVers 1.7 will not give any TropProf.
Product status
A product status as described in Chapter 1 for each output product. A former product status may be added in parenthesis.
Observation mode
This describes where the instrument was pointing during the measurements. The observation mode can be “Direct sun” or “Direct moon” (see Section 4.2) or “Profile” (see Section 4.3).
Measurements in a direct observation mode are processed with the “L2 Direct Algorithm” with output products TotCol and eventually also EffTemp (see ATBD, section “L2 Direct Algorithm”). Measurements in a profile mode are processed with the “L2 Air-Ratio Sky Algorithm” with output products TropCol, SurfConc and TropProf (see ATBD, section “L2 Air-Ratio Sky Algorithm”).
Filters used
Pandora uses a filterwheel, where different spectral filter can be placed, specifically a U340 and a BP300 filter. U340 is a colored glass bandpass filter with peak transmission at 340 nm. BP300 is an interference bandpass filter with peak transmission at 300 nm. If none of these filters is in place, the measurement is called OPEN. This setting indicates, on which type of filter settings the respective r-code is applied.
Effective height
This (comma-separated) string is only used for observation modes “Direct sun” or “Direct moon” and gives the assumed effective heights for each output trace gas used to calculate the direct air mass factor (AMF, see Section 4.2). For observation mode “profile” it is not given.
Each sub-string is either a value in km or a string representing a profile type from a climatology. The options for the climatology are listed in section “Climatologies” of the ATBD. The string can be followed by an uncertainty estimation in round parenthesis. This estimation can be a value in km or a string representing a profile type. E.g. “O3(2.4)” would mean the effective height is taken from the ozone climatology and its uncertainty is 2.4 km. If the uncertainty estimation is not given and a string representing a profile type is set for the effective height, then the uncertainty estimation is taken from the same climatology too, i.e. “O3” has the same effect as “O3(O3)”. If the uncertainty estimation is not given and a value in km is set for the effective height, the retrieval uses half of the effective height as uncertainty, i.e. “7.2” has the same effect as “7.2(3.6)”. Sub-strings can also be combined using “+” for the direct sun or moon observation mode, e.g. “BL+STRAT”. In this case different effective height-estimations are used to get the best estimation of the AMF.
Number of fitting windows
This is either 1 or 2. In the latter case 2 separate fitting processes are performed and the final output data are a combination of the results of both of them (see ATBD, section “L2 Direct Algorithm”). In this case the remaining entries of the table can be strings separated by a semicolon, but only if the 2 fitting processes use different settings. The 2nd part of the string, after the semicolon, is then written in italic for easier distinction.
Reference(s)
The reference spectra used in the spectral fitting. It is one of the following options (more detail in the ATBD, table “Options for ‘Reference’):
Theoretical reference spectrum: an extraterrestrial spectrum from another source (i.e. not measured by the Pandora unit), convoluted with the Pandora filter function and sensitivity. BlickP uses for this purpose a high resolution extraterrestrial spectrum from 270 nm to 1000 nm merged from different sources in a similar way as described in Bernhard et al. (2004). For PGN data products using this theoretical reference, there is no common uncertainty output given (see Section 5.2). This does NOT mean, that such common uncertainty does not exist, it is just not quantified in the current version of BlickP yet. A rough estimation of the common uncertainty for these products is given in the specific readme pages.
Synthetic reference spectrum: a spectrum, which is usually the average over several spectra measured by the Pandora unit and corrected for the estimated total optical depth from the different atmospheric extinction processes included in it. The uncertainty is these estimated optical depths, which are determined during the instrument calibration, is the driver for the common uncertainty of the product. Typically the calibration works better at stations, which are not always polluted, and consequently works worse at continuously polluted places such as large cities, which is then reflected in the common uncertainty output.
Largest pointing zenith angle: the spectrum measured by the instrument at the highest pointing zenith angle of the measurement sequence is used as a reference. This measurement is typically below 3° above the horizon. Since BlickP does not assume any systematic instrumental changes within the measurements of one sequence, the obtained column amount with this reference do not have a common uncertainty output.
Wavelength window(s)
The lower and upper limits of the wavelength window(s) used in the spectral fitting in nanometer [nm].
Order(s) of polynomials
The orders of the smoothing polynomial, “SMO”, offset polynomial, “OFFS”, wavelength change polynomial, “WLC”, and resolution change polynomial “RSC” used in the spectral fitting (see ATBD, section “L2Fit Algorithm - Spectral Fitting”). E.g. “SMO 4, OFFS 0, WLC 1, RSC 0” means a 4th order smoothing, 0 order offset, 1st order wavelength change polynomial and a zero order resolution correction polynomial have been used. A value of “-1” means that the respective polynomial is not used in the fitting.
Fitted gases
A comma separated string listing the trace gases used in the spectral fitting, the source of the cross sections and the treatment of the temperature. Each substring has format “GGG (TTT)”. GGG refers to an entry of Table 3.1, which lists the source of the cross sections for the respective trace gas. TTT describes the temperature treatment and can be:
“T-fit”: the effective temperature is fitted.
A temperature value: this means the cross sections at this fixed temperature (e.g. 225.0 K ) are used in the fitting.
“XX-clim”: the spectral fitting uses the temperature from climatology “XX” (see ATBD, section “Climatologies”). E.g. “O3-clim” means the effective ozone temperature climatology is used.
Ring
This is “Fitted”, if the Rotational Raman Scattering (Grainger and Ring 1962) was included in the spectral fitting, and “Not fitted” otherwise.
Molecular scattering
This is “Subtracted”, if the molecular scattering cross sections (Bodhaine et al. 1999; Owens 1967) have been subtracted before the spectral fitting, and “Not subtracted” otherwise.
Uncertainty
This entry indicates how the uncertainty was included in the spectral fitting. There are 3 options (for more detail in ATBD, section “L2Fit Algorithm - Spectral Fitting”):
NO: no uncertainty was included in the spectral fitting.
INSTR: the independent instrumental uncertainty was included in the spectral fitting.
MEAS: uncertainty based on the standard deviation over the measurement cycles was included in the spectral fitting.
AMF limits
AMF limits and the other entries in the tables including the word “limits” are threshold values used to determine the data quality. They have two comma-separated values, which represent the limits for this parameter to change the last digit of the Data Quality Flag (DQF) from 0 to 1 and from 1 to 2 respectively. More information on the data quality is given in the ATBD, section “Data quality flags” and in Section 5.4 here. AMF limits refers to the maximum allowed direct AMF for a given DQ. E.g. “AMF limits: 7, 14” means that measurement taken at AMF>7 receive a unit-value of the DQF of 1 and those at AMF>14 even a DQF unit-value of 2.
AtmVar limits
AtmVar stands for the atmospheric variability. This is a percentage <100% indicating the magnitude of the atmospheric variability during the measurements. Small numbers mean the atmosphere was very stable. Higher numbers mean there was more and more variability in the atmosphere. Numbers close to 100% are typically obtained, when a cloud moves in or out of the beam during a direct sun measurement. More details can be found in the ATBD, section “L1 Uncertainty”.
Wavelength shift limits
This refers to the maximum allowed wavelength shift obtained in the spectral direct for a given DQ in nanometer [nm].
wrms limits
This refers to the maximum allowed values for the normalized rms of the fitting residuals weighted with the independent uncertainty (see also ATBD, section “Residuals”).
2.2 rfuh4
fuh4 provides HCHO TropCols, SurfDens and TropProfs. A comparison of the data from this algorithm with other profile retrievals can be found in Tirpitz et al. (2021).
On 21 May 2021 it has been replaced by nvs1 and is now “disused”.
| r-code | fuh4 |
|---|---|
| Code creator | Elena Spinei Lind, 30 Dec 2020 |
| DQ limits creator | Martin Tiefengraber, 11 May 2017 |
| Data products | HCHO TropCol [mol/m\(^2\)], HCHO SurfConc [mol/m\(^3\)], HCHO TropProf [mol/m\(^2\)] |
| Processor requirement | 1.7 and higher |
| Product status | disused, disused, disused |
| Observation mode | Profile |
| Filters used | OPEN, U340 |
| Number of fitting windows | 1 |
| Reference | Largest pointing zenith angle |
| Wavelength window | 328.5 nm - 359.0 nm |
| Order of polynomials | SMO 4, OFFS 1, WLC 1, RSC -1 |
| Fitted gases | O3-2 (BL-clim), NO2-1 (BL-clim), HCHO-1 (BL-clim), O2O2-1 (BL-clim) |
| Ring | Fitted |
| Molecular scattering | Not subtracted |
| Uncertainty | INSTR |
| AMF limits | 6, 10 |
| AtmVar limits | 20, 40 |
| Wavelength shift limits | 0.05, 0.1 |
| wrms limits | 1e-3, 3e-3 |
2.3 rfuh5
fuh5 is as fuh4, but uses of updated quality flag thresholds based on Gebetsberger et al. (2022).
fuh5 is the first official PGN code for HCHO TropCols, SurfDens and TropProfs.
| r-code | fuh5 |
|---|---|
| Code creator | Elena Spinei Lind, 30 Dec 2020 |
| DQ limits creator | Manuel Gebetsberger, 21 May 2021 |
| Data products | HCHO TropCol [mol/m\(^2\)], HCHO SurfConc [mol/m\(^3\)], HCHO TropProf [mol/m\(^2\)] |
| Processor requirement | 1.8 and higher |
| Product status | official, official, official |
| Observation mode | Profile |
| Filters used | OPEN, U340 |
| Number of fitting windows | 1 |
| Reference | Largest pointing zenith angle |
| Wavelength window | 328.5 nm - 359.0 nm |
| Order of polynomials | SMO 4, OFFS 1, WLC 1, RSC -1 |
| Fitted gases | O3-2 (BL-clim), NO2-1 (BL-clim), HCHO-1 (BL-clim), O2O2-1 (BL-clim) |
| Ring | Fitted |
| Molecular scattering | Not subtracted |
| Uncertainty | INSTR |
| AMF limits | 6, 10 |
| AtmVar limits | 81, 85 |
| Wavelength shift limits | 0.05, 0.1 |
| wrms limits | 1.12e-3, 1.50e-3 |
2.4 rfus5
fus5 provides HCHO TotCols. This code is only applied to instruments, which have no Delrin parts in the head sensor left (see Spinei et al. (2020)). It is the first official PGN code for HCHO TotCols.
HCHO is a weak absorber and therefore the user should read Section 6.4.1 before using fus5 data.
| r-code | fus5 |
|---|---|
| Code creator | Martin Tiefengraber, 30 Oct 2020 |
| DQ limits creator | Manuel Gebetsberger, 21 May 2021 |
| Output product | HCHO TotCol [mol/m\(^2\)] |
| Processor requirement | 1.8 and higher |
| Product status | official |
| Observation mode | Direct sun |
| Filters used | U340 |
| Effective height | BL |
| Number of fitting windows | 1 |
| Reference | Synthetic reference spectrum |
| Wavelength window | 322.5 nm - 359.2 nm |
| Order of polynomials | SMO 4, OFFS 0, WLC 0, RSC 0 |
| Fitted gases | O3-2 (O3-clim), NO2-1 (BL-clim), SO2-2 (BL-clim), HCHO-1 (BL-clim), HONO-1 (BL-clim), BrO-1 (O3-clim) |
| Ring | Not fitted |
| Molecular scattering | Subtracted |
| Uncertainty | INSTR |
| AMF limits | 6, 10 |
| AtmVar limits | 61, 70 |
| Wavelength shift limits | 0.05, 0.1 |
| wrms limits | 4.9e-4, 7.0e-4 |
2.5 rnvh2
nvh2 provides NO2 TropCols, SurfDens and TropProfs. A comparison of the data from this algorithm with other profile retrievals can be found in Tirpitz et al. (2021).
On 21 May 2021 it has been replaced by nvs1 and is now “disused”.
| r-code | nvh2 |
|---|---|
| Code creator | Elena Spinei Lind, 20 Jan 2017 |
| DQ limits creator | Alexander Cede, 20 Jan 2017 |
| Data products | NO2 TropCol [mol/m\(^2\)], NO2 SurfConc [mol/m\(^3\)], NO2 TropProf [mol/m\(^2\)] |
| Processor requirement | 1.8 and higher |
| Product status | disused, disused, disused |
| Observation mode | Profile |
| Filters used | OPEN, U340 |
| Number of fitting windows | 1 |
| Reference | Largest pointing zenith angle |
| Wavelength window | 435.0 nm - 490.0 nm |
| Order of polynomials | SMO 4, OFFS 1, WLC 1, RSC -1 |
| Fitted gases | O3-2 (BL-clim), NO2-1 (BL-clim), H2O-1 (BL-clim), O2O2-1 (BL-clim) |
| Ring | Fitted |
| Molecular scattering | Not subtracted |
| Uncertainty | INSTR |
| AMF limits | 7, 14 |
| AtmVar limits | 81, 85 |
| Wavelength shift limits | 0.05, 0.1 |
| wrms limits | 6.9e-4, 9.1e-4 |
2.6 rnvh3
nvh3 is as nvh2, but uses updated quality flag thresholds based on Gebetsberger et al. (2022).
nvh3 is the first official PGN code for NO2 TropCols, SurfDens and TropProfs.
| r-code | nvh3 |
|---|---|
| Code creator | Elena Spinei Lind, 20 Jan 2017 |
| DQ limits creator | Manuel Gebetsberger, 21 May 2021 |
| Data products | NO2 TropCol [mol/m\(^2\)], NO2 SurfConc [mol/m\(^3\)], NO2 TropProf [mol/m\(^2\)] |
| Processor requirement | 1.8 and higher |
| Product status | official, offical, official |
| Observation mode | Profile |
| Filters used | OPEN, U340 |
| Number of fitting windows | 1 |
| Reference | Largest pointing zenith angle |
| Wavelength window | 435.0 nm - 490.0 nm |
| Order of polynomials | SMO 4, OFFS 1, WLC 1, RSC -1 |
| Fitted gases | O3-2 (BL-clim), NO2-1 (BL-clim), H2O-1 (BL-clim), O2O2-1 (BL-clim) |
| Ring | Fitted |
| Molecular scattering | Not subtracted |
| Uncertainty | INSTR |
| AMF limits | 7, 14 |
| AtmVar limits | 81, 85 |
| Wavelength shift limits | 0.05, 0.1 |
| wrms limits | 6.9e-4, 9.1e-4 |
2.7 rnvs0
nvs0 was the first code used for the official PGN total column NO2 product. On 4 Nov 2019 it has been replaced by nvs1 and is now “disused”.
All of the existing data with this code were processed with BlickP version 1.7, which does not have such a comprehensive uncertainty output as version 1.8. 1.7 still reports the NO2 TotCol in DU, where 1 DU corresponds to 4.4615e-4 mol/m\(^2\). The total uncertainty for nvs0 data with DQF 0, which were processed with BlickP version 1.7, is typically estimated to 0.05 DU = 2.25e-5 mol/m\(^2\) divided by the direct AMF, based on Herman et al. (2009).
The main shortcomings of nvs0 data are:
The effective height and temperature of the NO2 profile are fixed to 7.2 km and 254.4 K respectively. These values assume an NO2 profile with about 40% of the column in the stratosphere and 60% in the troposphere. However in real situations the tropospheric fraction can very from 0% to >90% which would alter theses estimations significantly. This creates biases in stations, which systematically have a different tropospheric fractions and could best be seen on rural or high altitude sites without pollution.
The wrms limits are set in a to little rigorous way and therefore data got DQF 0 or 1, when they should have rather gotten higher DQFs.
NO2 is a spatially heterogeneous trace gases and therefore the user should read Section 6.2 before using nvs0 data.
| r-code | nvs0 |
|---|---|
| Code creator | Alexander Cede, 20 Jan 2017 |
| DQ limits creator | Alexander Cede, 20 Jan 2017 |
| Output product | NO2 TotCol [mol/m\(^2\)] |
| Processor requirement | 1.7 and higher |
| Product status | disused (official until 4 Nov 2019) |
| Observation mode | Direct sun |
| Filters used | OPEN |
| Effective height | 7.2 km |
| Number of fitting windows | 1 |
| Reference | Synthetic reference spectrum |
| Wavelength window | 400.0 nm - 440.0 nm |
| Order of polynomials | SMO 4, OFFS 0, WLC 1, RSC -1 |
| Fitted gases | O3-1 (225.0 K), NO2-1 (254.5 K) |
| Ring | Not fitted |
| Molecular scattering | Subtracted |
| Uncertainty | MEAS |
| AMF limits | 7, 14 |
| AtmVar limits | 20, 40 |
| Wavelength shift limits | 0.2, 0.5 |
| wrms limits | 2e-3, 5e-3 |
2.8 rnvs1
nvs1 has replaced nvs0 as official PGN total column NO2 product code on 4 Nov 2019, and was itself replaced by nvs2 on 20 Nov 2020. It differs from nvs0 in the thresholds for the wavelength shift and wrms limits to avoid that medium and low quality data “slip” into the segments of high and medium quality data respectively. All other aspects for the nvs1 data are the same as for nvs0 data.
The main shortcoming of nvs1 data is:
- The effective height and temperature of the NO2 profile are fixed to 7.2 km and 254.4 K respectively. These values assume an NO2 profile with about 40% of the column in the stratosphere and 60% in the troposphere. However in real situations the tropospheric fraction can very from 0% to >90% which would alter theses estimations significantly. This creates biases in stations, which systematically have a different tropospheric fractions and could best be seen on rural or high altitude sites without pollution (Figure 2.1).
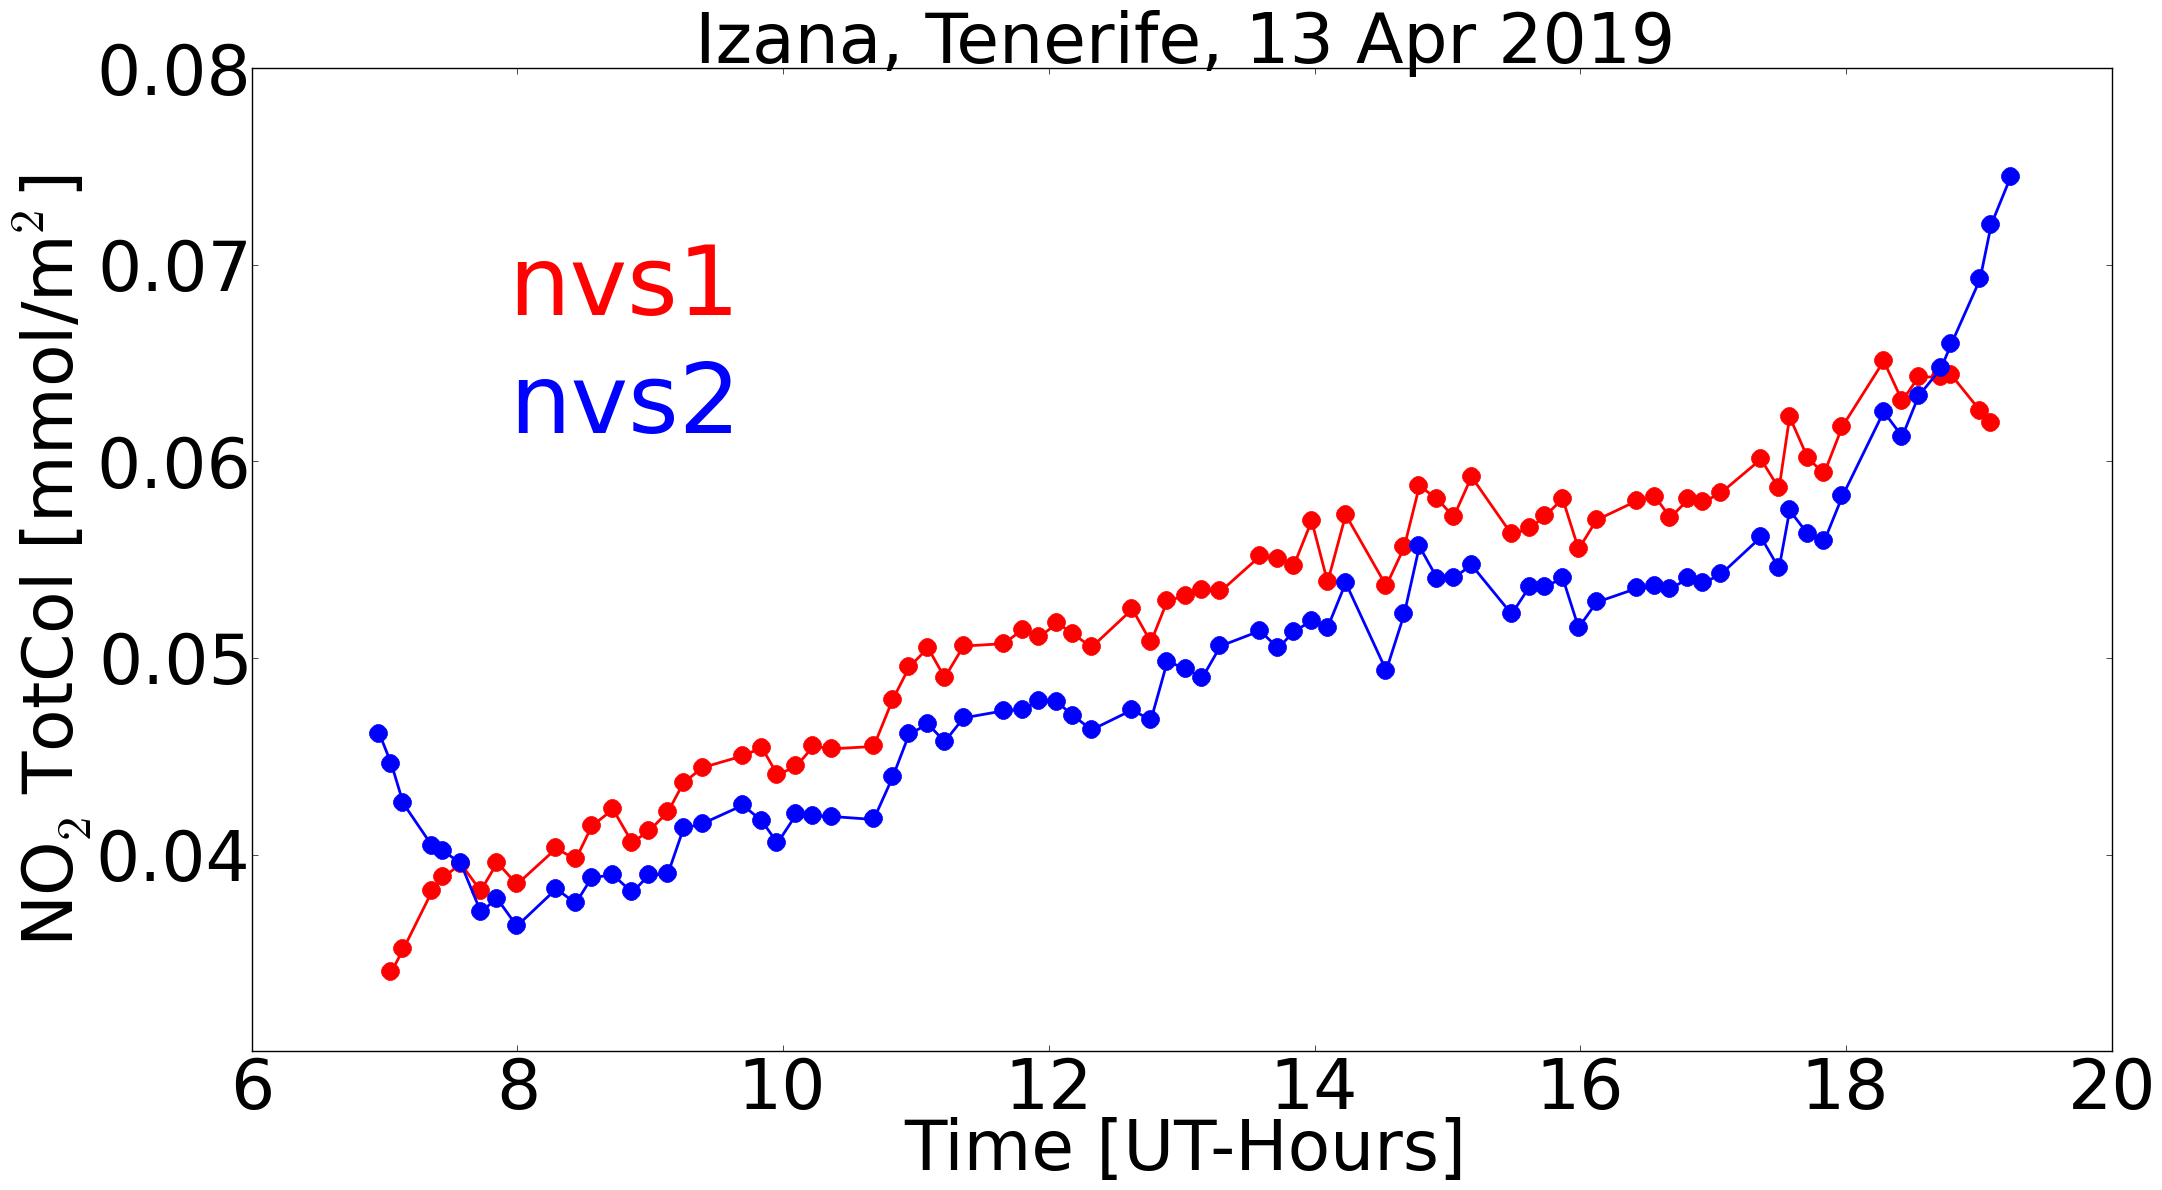
NO2 is a spatially heterogeneous trace gases and therefore the user should read Section 6.2 before using nvs1 data.
| r-code | nvs1 |
|---|---|
| Code creator | Manuel Gebetsberger, 4 Nov 2019 |
| DQ limits creator | Manuel Gebetsberger, 4 Nov 2019 |
| Output product | NO2 TotCol [mol/m\(^2\)] |
| Processor requirement | 1.7 and higher |
| Product status | disused |
| Observation mode | Direct sun |
| Filters used | OPEN |
| Effective height | 7.2 km |
| Number of fitting windows | 1 |
| Reference | Synthetic reference spectrum |
| Wavelength window | 400.0 nm - 440.0 nm |
| Order of polynomials | SMO 4, OFFS 0, WLC 1, RSC -1 |
| Fitted gases | O3-1 (225.0 K), NO2-1 (254.5 K) |
| Ring | Not fitted |
| Molecular scattering | Subtracted |
| Uncertainty | MEAS |
| AMF limits | 7, 14 |
| AtmVar limits | 20, 40 |
| Wavelength shift limits | 0.05, 0.1 |
| wrms limits | 9.3e-4, 1.95e-3 |
2.9 rnvs2
nvs2 is the first code for NO2 TotCols, which makes use of the new capabilities of the v1.8 processor. It has replaced nvs1 as official PGN total column NO2 product code on 20 Nov 2020, and was itself replaced by nvs3 on 21 May 2021.
Here the main improvements of nvs2 over nvs1:
Two spectral fittings are applied, which differ only by the EffTemp of NO2. It is taken from the boundary layer climatology in one case (“BL-clim”) and from the stratospheric NO2 climatology in the other case (“NO2s-clim”). Using the NO2 stratospheric column climatology, a so-called tropospheric fraction is determined (see ATDB, section “Case 4”).
For the final NO2 TotCol an effective height from the boundary layer climatology is applied to the tropospheric fraction and an effective height from the stratospheric NO2 climatology is applied to the stratospheric fraction.
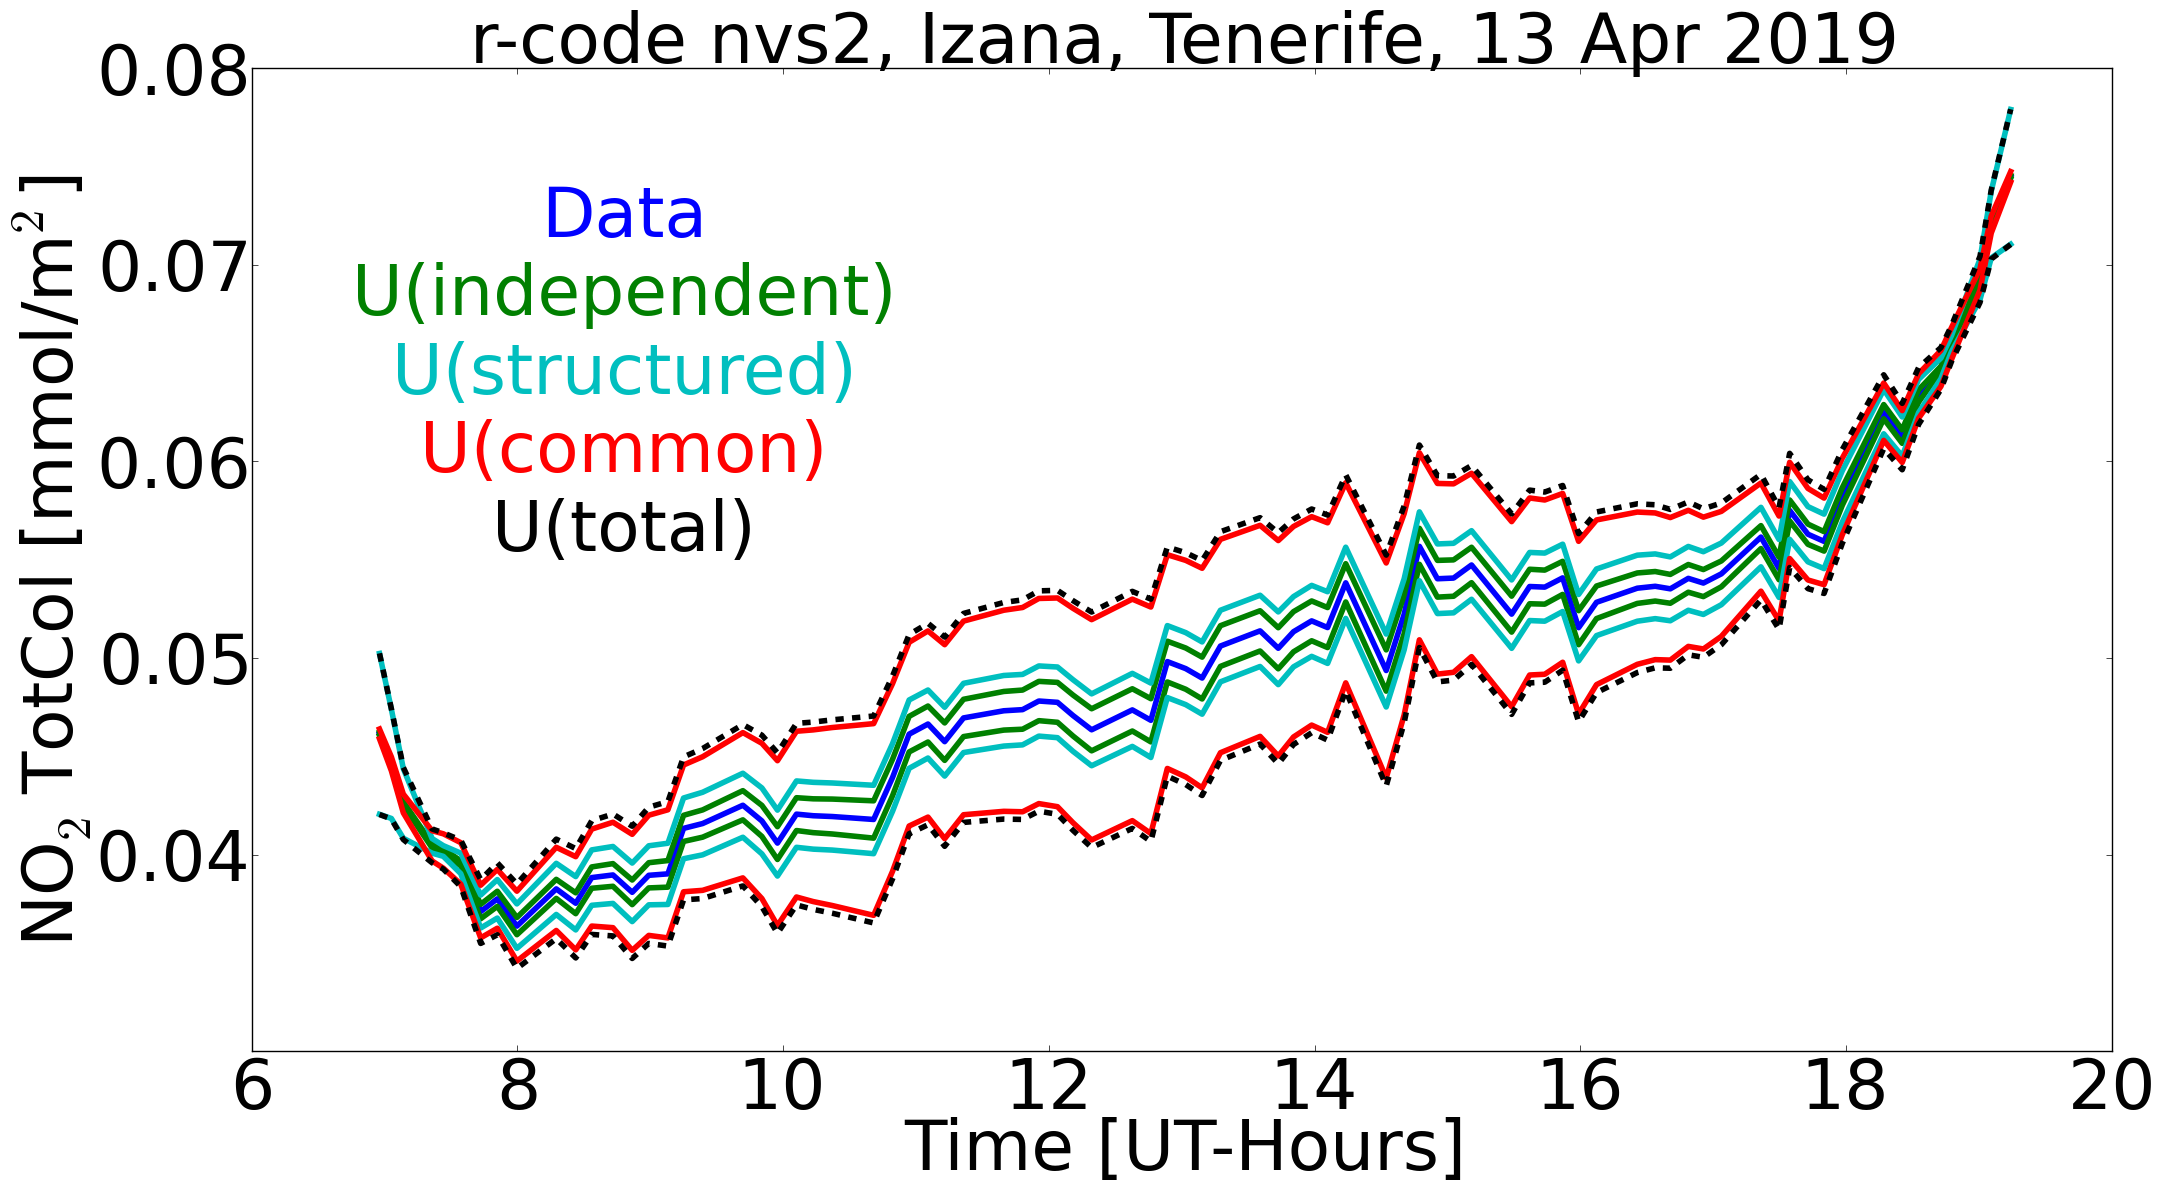
With these changes we believe the major shortcomings of previous retrieval codes for NO2 TotCOls are significantly reduced. NO2 is a spatially heterogeneous trace gases and therefore the user should read Section 6.2 before using nvs2 data.
| r-code | nvs2 |
|---|---|
| Code creator | Alexander Cede & Martin Tiefengraber, 20 Nov 2020 |
| DQ limits creator | Manuel Gebetsberger, 4 Nov 2019 |
| Output product | NO2 TotCol [mol/m\(^2\)] |
| Processor requirement | 1.8 and higher |
| Product status | disused |
| Observation mode | Direct sun |
| Filters used | OPEN |
| Effective heights | BL+NO2s |
| Number of fitting windows | 2 |
| Reference | Synthetic reference spectrum |
| Wavelength window | 400.0 nm - 470.0 nm |
| Order of polynomials | SMO 4, OFFS 0, WLC 0, RSC -1 |
| Fitted gases | O3-2 (O3-clim), NO2-1 (BL-clim), O2O2-1 (O2O2-clim), H2O-1 (BL-clim), OIO-1 (BL-clim), I2-1 (BL-clim); O3-2 (O3-clim), NO2-1 (NO2s-clim), O2O2-1 (O2O2-clim), H2O-1 (BL-clim), OIO-1 (BL-clim), I2-1 (BL-clim) |
| Ring | Not fitted |
| Molecular scattering | Subtracted |
| Uncertainty | INSTR |
| AMF limits | 7, 14 |
| AtmVar limits | 20, 40 |
| Wavelength shift limits | 0.05, 0.1 |
| wrms limits | 9.3e-4, 1.95e-3 |
2.10 rnvs3
nvs3 is as nvs2, but uses updated quality flag thresholds based on Gebetsberger et al. (2022). It has replaced nvs2 as official PGN total column NO2 product code on 21 May 2021.
| r-code | nvs3 |
|---|---|
| Code creator | Alexander Cede & Martin Tiefengraber, 20 Nov 2020 |
| DQ limits creator | Manuel Gebetsberger, 21 May 2021 |
| Output product | NO2 TotCol [mol/m\(^2\)] |
| Processor requirement | 1.8 and higher |
| Product status | official |
| Observation mode | Direct sun |
| Filters used | OPEN |
| Effective heights | BL+NO2s |
| Number of fitting windows | 2 |
| Reference | Synthetic reference spectrum |
| Wavelength window | 400.0 nm - 470.0 nm |
| Order of polynomials | SMO 4, OFFS 0, WLC 0, RSC 0 |
| Fitted gases | O3-2 (O3-clim), NO2-1 (BL-clim), O2O2-1 (O2O2-clim), H2O-1 (BL-clim), OIO-1 (BL-clim), I2-1 (BL-clim); O3-2 (O3-clim), NO2-1 (NO2s-clim), O2O2-1 (O2O2-clim), H2O-1 (BL-clim), OIO-1 (BL-clim), I2-1 (BL-clim) |
| Ring | Not fitted |
| Molecular scattering | Subtracted |
| Uncertainty | INSTR |
| AMF limits | 7, 14 |
| AtmVar limits | 36, 42 |
| Wavelength shift limits | 0.05, 0.1 |
| wrms limits | 9.7e-4, 1.52e-3 |
2.11 rous1
ous1 is the first official PGN-code fitting the O3 EffTemp, which is possible by using the synthetic reference spectrum instead of the theoretical one.
Although O3 TotCols from ous1 are more accurate than from the simultaneously used code out2 due to the temperature fitting, out2 is also offered officially for the following two reasons:
out2 is purely based on laboratory calibration, while ous1 needs field calibration. Hence ous1 cannot be used until such calibration is done. Furthermore, out2 is needed to produce a first guess O3 TotCol for the field calibration of ous1.
ous1 cannot be applied to all PGN instruments yet, since it requires absolute calibration and high-quality stray light calibration to be performed on a Pandora. For the instrument lacking such calibration, out2 can be used. Note that data based on the processor version 1.9 are spectral stray light corrected. For these datasets, ous1 will be included.
Please also note the general recommendations for data products retrieved in the UV in Section 6.3.
| r-code | ous1 |
|---|---|
| Code creator | Martin Tiefengraber, 13 Aug 2020 |
| DQ limits creator | Manuel Gebetsberger, 21 May 2021 |
| Output product | O3 TotCol [mol/m\(^2\)], O3 EffTemp [K] |
| Processor requirement | 1.9 and higher |
| Product status | official, official |
| Observation mode | Direct sun |
| Filters used | U340 |
| Effective height | O3 |
| Number of fitting windows | 1 |
| Reference | Synthetic reference spectrum |
| Wavelength window | 305.0 nm - 333.0 nm |
| Order of polynomials | SMO 1, OFFS 0, WLC 0, RSC 0 |
| Fitted gases | O3-2 (T-fit), NO2-1 (BL-clim), SO2-2 (BL-clim), HCHO-1 (BL-clim), HONO-1 (BL-clim), BrO-1 (O3-clim) |
| Ring | Not fitted |
| Molecular scattering | Subtracted |
| Uncertainty | INSTR |
| AMF limits | 4, 7 |
| AtmVar limits | 38, 90 |
| Wavelength shift limits | 0.05, 0.1 |
| wrms limits | 8.7e-4, 1.29e-3 |
2.12 rout0
out0 is the first code for O3 TotCols provided within the PGN. However, due to its shortcomings described below, it was never officially used to perform satellite validation and is now disused and replaced by codes out2 and ous1.
All of the existing data with this code were processed with BlickP version 1.7, which reports the O3 TotCol in DU, where 1 DU corresponds to 4.4615e-4 mol/m\(^2\). The total uncertainty for out0 data with DQF 0, which were processed with BlickP version 1.7, is typically estimated to 12 DU = 5.4e-3 mol/m\(^2\), based on Zhao et al. (2016).
The main shortcomings of out0 data and reasons for the limited accuracy, even if processed with v1.8, are listed below. They are discussed in more detail e.g. in Müller et al. (2016) and Tiefengraber and Cede (2016).
The retrieval is purely based on laboratory calibration. Any non-smooth structure in the instrument’s spectral sensitivity inside the fitting wavelength range (310 to 330 nm) can cause a systematic bias in the data. This is especially true for units, which have not undergone absolute calibration in the laboratory. Studies from year 2020 have shown, that this issue can be reduced with different settings for the spectral fitting, and retrieval code out1 has been developed as a consequence.
The algorithm assumes a fixed effective O3 temperature of 225 K, which commonly leads to underestimation (overestimation) of the total O3 column in summer (winter). Therefore a seasonal difference between PGN data and other measurements, which take the EffTemp into account, is seen. This issue is be reduced with code out1, which uses climatological data for the O3 EffTemp and even more with code ous0, where the O3 EffTemp is fitted.
out0 is retrieved in the short UV wavelength and therefore the user should read Section 6.3 before using out0 data.
| r-code | out0 |
|---|---|
| Code creator | Alexander Cede, 20 Jan 2017 |
| DQ limits creator | Alexander Cede, 20 Jan 2017 |
| Data products | O3 TotCol [mol/m\(^2\)], SO2 TotCol [mol/m\(^2\)] |
| Processor requirement | 1.7 and higher |
| Product status | disused, unusable |
| Observation mode | Direct sun |
| Filters used | U340 |
| Effective heights | 20.4 km, 4.0 km |
| Number of fitting windows | 1 |
| Reference | Theoretical reference spectrum |
| Wavelength window | 310.0 nm - 330.0 nm |
| Order of polynomials | SMO 4, OFFS 0, WLC 1, RSC -1 |
| Fitted gases | O3-1 (225.0 K), NO2-1 (254.5 K), SO2-1 (259.2 K), HCHO-1 (256.9 K) |
| Ring | Not fitted |
| Molecular scattering | Subtracted |
| Uncertainty | MEAS |
| AMF limits | 5, 7 |
| AtmVar limits | 20, 40 |
| Wavelength shift limits | 0.5, 1.0 |
| wrms limits | 0.01, 0.02 |
2.13 rout1
out1 is the first code for O3 TotCols, which makes use of the new capabilities of the v1.8 processor. As out0, out1 has also never been used as an official code and is now disused.
Here the main characteristics of out1 and improvements over out0:
As for out0, the retrieval is purely based on laboratory calibration. However the sensitivity to non-smooth structures in the instrument’s spectral sensitivity causing a systematic bias in the data has been greatly reduced by applying several changes to the fitting window: the wavelength range has been shifted down by 5 nm, only O3 and SO2 are fitted, and the orders of both the smoothing and offset polynomials have been reduced.
Instead of using a fixed effective O3 temperature, out1 uses the climatological value. This reduces the bias due to a mismatch of the true EffTemp and the one used in the retrieval significantly.
out1 is retrieved in the short UV wavelength and therefore the user should read Section 6.3 before using out1 data.
| r-code | out1 |
|---|---|
| Code creator | Martin Tiefengraber, 3 Aug 2020 |
| DQ limits creator | Alexander Cede, 20 Jan 2017 |
| Output product | O3 TotCol [mol/m\(^2\)] |
| Processor requirement | 1.8 and higher |
| Product status | disused |
| Observation mode | Direct sun |
| Filters used | U340 |
| Effective height | O3 |
| Number of fitting windows | 1 |
| Reference | Theoretical reference spectrum |
| Wavelength window | 305.0 nm - 325.0 nm |
| Order of polynomials | SMO 3, OFFS -1, WLC 0, RSC -1 |
| Fitted gases | O3-2 (O3-clim), SO2-2 (BL-clim) |
| Ring | Not fitted |
| Molecular scattering | Subtracted |
| Uncertainty | INSTR |
| AMF limits | 5, 7 |
| AtmVar limits | 20, 40 |
| Wavelength shift limits | 0.5, 1.0 |
| wrms limits | 0.01, 0.02 |
2.14 rout2
out2 is as out1, but uses updated quality flag thresholds based on Gebetsberger et al. (2022). It is the first official PGN code for O3 TotCols together with code ous1 (which will be distributed starting with the processor version 1.9).
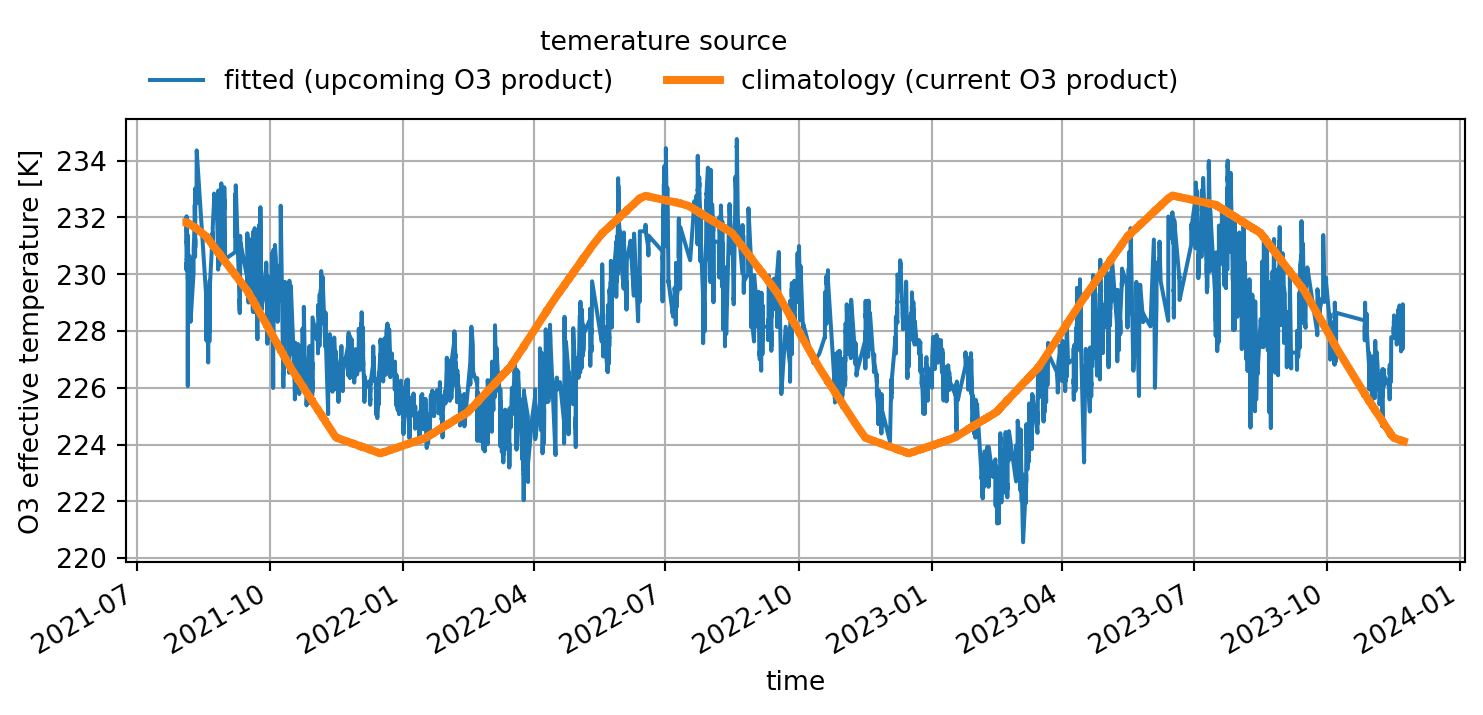
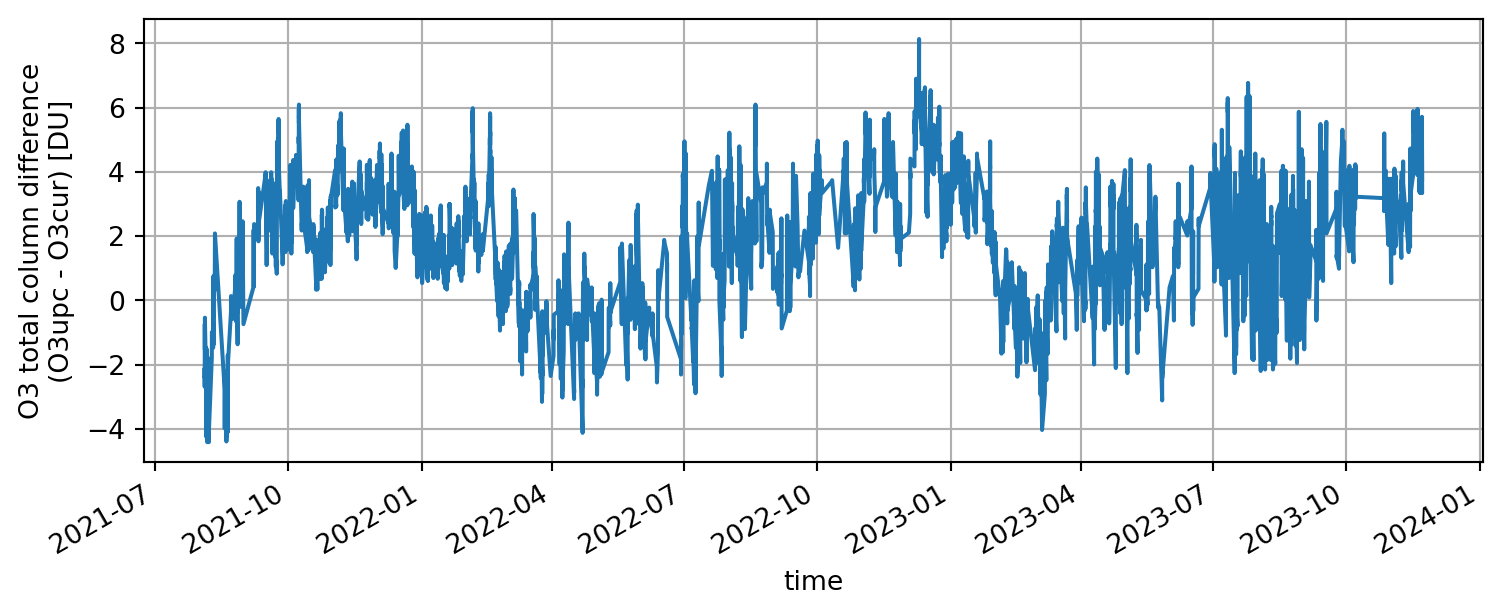
Please be aware that offsets from the climatological effective O3 temperature to the actual temperature will cause an apparent seasonal biases in O3 TotCol. This is exemplarily shown in Figure 2.3 for the O3 timeseries in Tsukuba, Japan (PI: Tamaki Fujinawa). The shifted climatological temperature (orange line in Figure 2.3 (a)) compared to the retrieved (from ous1, blue line in Figure 2.3 (a)) translates into an artificial seasonal bias in O3 TotCol (Figure 2.3 (b), showing ous1 minus out2).
Please also note the general recommendations for data products retrieved in the UV in Section 6.3.
| r-code | out2 |
|---|---|
| Code creator | Martin Tiefengraber, 3 Aug 2020 |
| DQ limits creator | Manuel Gebetsberger, 21 May 2021 |
| Output product | O3 TotCol [mol/m\(^2\)] |
| Processor requirement | 1.8 and higher |
| Product status | official |
| Observation mode | Direct sun |
| Filters used | U340 |
| Effective height | O3 |
| Number of fitting windows | 1 |
| Reference | Theoretical reference spectrum |
| Wavelength window | 305.0 nm - 325.0 nm |
| Order of polynomials | SMO 3, OFFS -1, WLC 0, RSC -1 |
| Fitted gases | O3-2 (O3-clim), SO2-2 (BL-clim) |
| Ring | Not fitted |
| Molecular scattering | Subtracted |
| Uncertainty | INSTR |
| AMF limits | 5, 7 |
| AtmVar limits | 64, 73 |
| Wavelength shift limits | 0.5, 1.0 |
| wrms limits | 6.40e-3, 6.76e-3 |
2.15 rsus1
sus1 is the first official PGN code for SO2 TotCols. It is similar to ous1, but with two major changes:
The wavelength range is shifted down by 4 nm in order to grab an additional strong SO2 absorption feature.
The order of the smoothing polynomial is increased to 4 in order to reduce the influence of a faulty stray light correction on the results.
sus1 is retrieved in the short UV wavelength and with this processor version no spectral stray light correction is applied to the spectra. Furthermore, although a potential resolution change is taken into account for each measured spectrum in the spectral fitting (see table), this is not done for the (Fraunhofer) reference spectrum itself. As a consequence of both, an artificial seasonality can be observed (amplitude < 0.05 DU) in data sets where the reference spectrum had to be selected from days with relatively high solar zenith angles (e.g. winter in the northern hemisphere).
Please also note the general recommendations for data products retrieved in the UV in Section 6.3.
| r-code | sus2 |
|---|---|
| Code creator | Martin Tiefengraber, 30 Oct 2020 |
| DQ limits creator | Manuel Gebetsberger, 21 May 2021 |
| Output product | SO2 TotCol [mol/m\(^2\)] |
| Processor requirement | 1.8 and higher |
| Product status | official |
| Observation mode | Direct sun |
| Filters used | U340 |
| Effective height | BL |
| Number of fitting windows | 1 |
| Reference | Synthetic reference spectrum |
| Wavelength window | 306.0 nm - 326.4 nm |
| Order of polynomials | SMO 4, OFFS 0, WLC 0, RSC 0 |
| Fitted gases | O3-2 (T-fit), NO2-1 (BL-clim), SO2-2 (BL-clim), HCHO-1 (BL-clim), HONO-1 (BL-clim), BrO-1 (O3-clim) |
| Ring | Not fitted |
| Molecular scattering | Subtracted |
| Uncertainty | INSTR |
| AMF limits | 3, 5 |
| AtmVar limits | 20, 40 |
| Wavelength shift limits | 0.05, 0.1 |
| wrms limits | 1e-3, 3e-3 |
2.16 rwvt1
wvt1 is the first official direct sun H2O Totcol product of the PGN. While H2O offers a large number of potential fitting windows, wvt1 utilizes the strongest band still covered by both the UV and the VIS Pandora channels, and exhibits the least temperature dependence at the same time. This band is centered around 505 nm and features optical depths for standard abundances (1 cm) well above 1e-3. The determination of the quality flag thresholds was done according to Gebetsberger et al. (2022).
| r-code | wvt1 |
|---|---|
| Code creator | Manuel Gebetsberger, 23 June 2022 |
| DQ limits creator | Manuel Gebetsberger, 31 May 2023 |
| Output product | H2O TotCol [mol/m\(^2\)] |
| Processor requirement | 1.8 and higher |
| Product status | official |
| Observation mode | Direct sun |
| Filters used | OPEN |
| Effective height | BL |
| Number of fitting windows | 1 |
| Reference | Theoretical reference spectrum |
| Wavelength window | 492.0 nm - 510.0 nm |
| Order of polynomials | SMO 1, OFFS -1, WLC 0, RSC -1 |
| Fitted gases | H2O-1 (BL-clim), O3-2 (O3-clim), NO2-1 (BL-clim) |
| Ring | Not fitted |
| Molecular scattering | Subtracted |
| Uncertainty | INSTR |
| AMF limits | 5, 7 |
| AtmVar limits | 40, 70 |
| Wavelength shift limits | 0.5, 1.0 |
| wrms limits | 3.78e-3, 4.59e-3 |